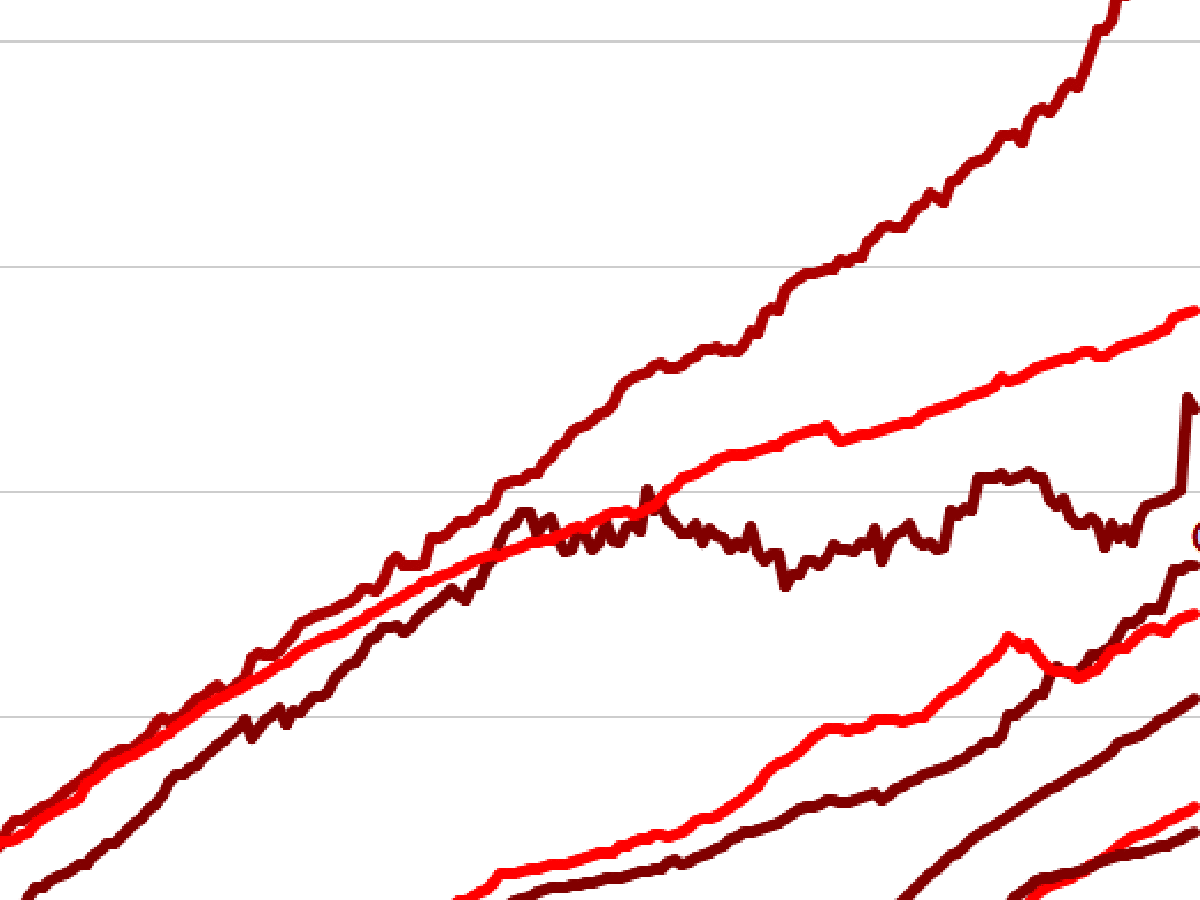
I use the “chart of the century” to show that not everything has gone up in price outpacing inflation, just the important things. … Read More
I use the “chart of the century” to show that not everything has gone up in price outpacing inflation, just the important things. … Read More
