If you are like most people, you think visually. A table of values might be nice to look at, but it doesn’t have the same impact of those values plotted in a visual way.
So it should surprise no one that I suggest that people think about their finances in a visual way too.
With that in mind, here’s an easy but helpful exercise you can do that will help you understand your own finances.
Introducing the money graph.
What is a money graph?
The money graph is a visual representation of the amount of money you have in your account during the course of the month.
It is an evocative graph, not a precise what-are-the-exact-units? graph. It’s not generated by some spreadsheet software. You don’t even need a ruler. The money graph is hand-drawn, by you.
And it’s good that it need not be super precise, as I’ve never been exactly confident of my own visual skills. Nevertheless, I will draw the examples here myself, so you’ll hopefully feel much better about doing the same.
How to draw your money graph
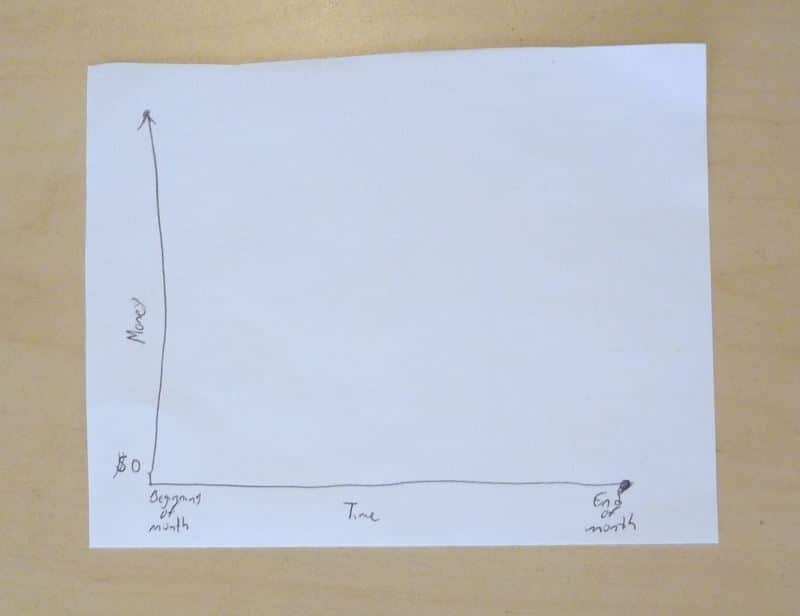
To start your money graph, draw a vertical axis and a horizontal axis as follows. The vertical axis represents money, while the horizontal axis represents time. Left side is the beginning of the month, right side is the end. Put a $0 on the bottom, but leave the rest of the vertical axis blank for now. (Click on the images to enlarge.)
Next step is to draw a curve in this space that closely matches the amount of money you have at various points of the month.
- When you get a paycheck, that’s a sharp upward spike.
- Small payments are smaller spikes.
- Rent/mortgage is a sharp downward plunge.
- Your bills are smaller plunges.
- As your expenses are slowly spent over the course of the month, the spikes end up being connected with a shallow but relatively steady decline.
Let’s see some examples:
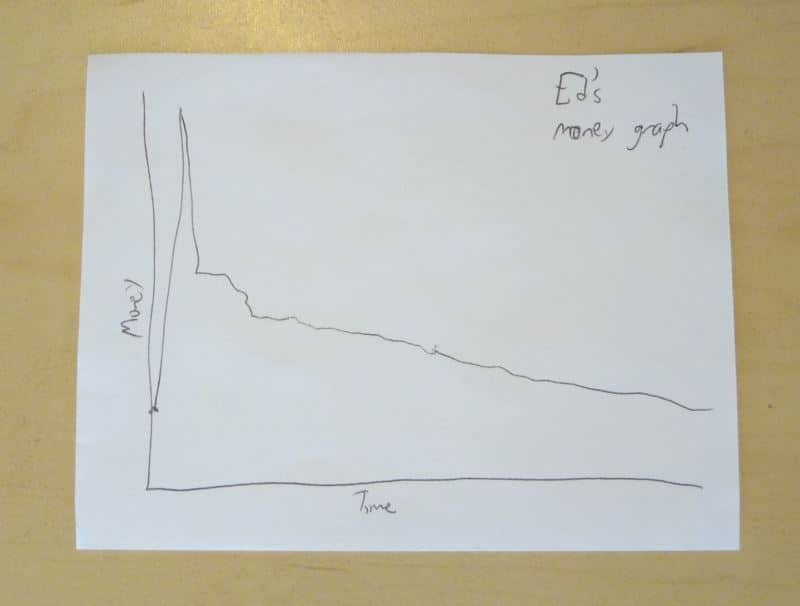
Example 1: Ed Zample gets paid once a month on the first of the month, pays rent the same day, and finishes all of his bills by the end of the first week. Here is his money graph.
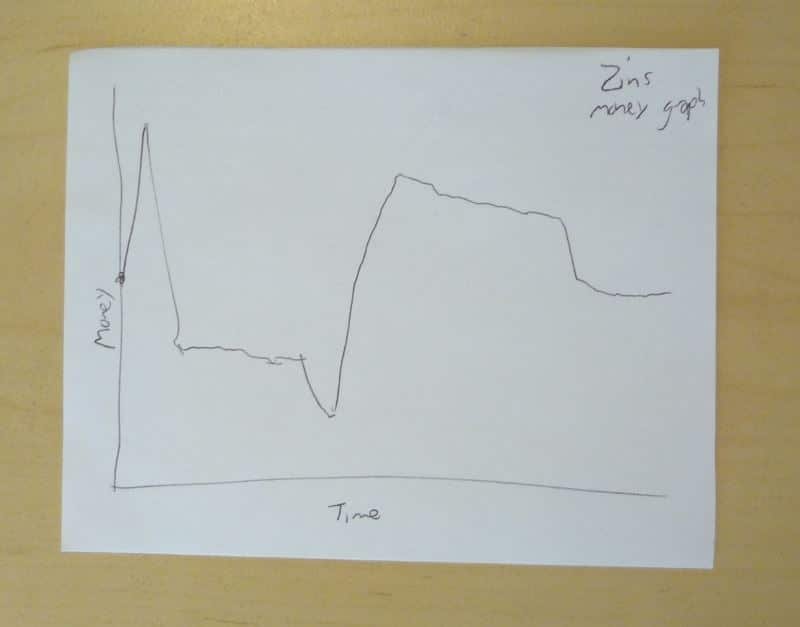
Example 2: Ed’s brother Zin gets paid twice a month, pays his mortgage first day, utilities second week, and the rest of his bills on the fourth week.
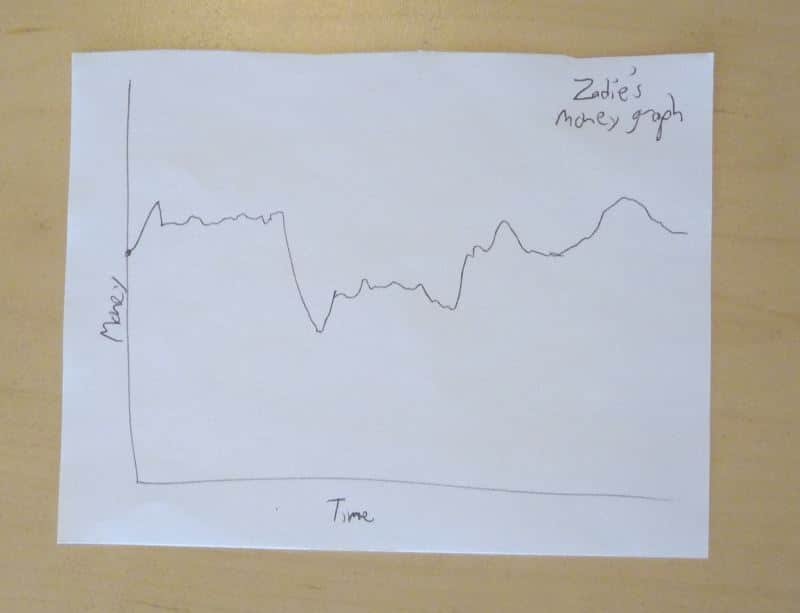
Example 3: Ed’s sister Zadie is a freelancer, and gets paid all over the place in the month. But most of her bills are due by the second week of the month.
Watch your head
We haven’t talked about the actual numbers on the left side, because I wanted you to get comfortable with the idea that this is supposed to be evocative and not precise.
But there is one aspect that needs to be precise, and that’s the zero point. In short, your money graph can’t ever dip below the horizontal axis, just as the money in your account can never go below zero. If you do that, you’ll overdraw your account and get hit with fees, or be forced to use your credit card.

To help you keep this in mind, picture your money graph as a pool and that line is your trajectory as you swim around or dive into it. If your graph hits the zero point, you will hit your head.
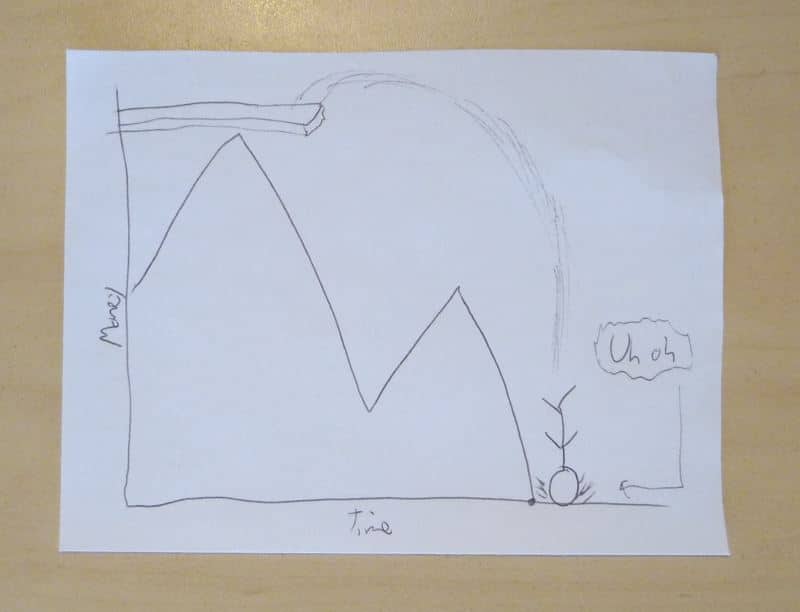
What’s the solution to hitting your head at the bottom of the pool? Right. Fill the pool with water. Hmmm, now what is the word I used for that?
Oh right, float! How fitting a name that was!
This is the same money graph with plenty of float, just enough float, and not enough float:
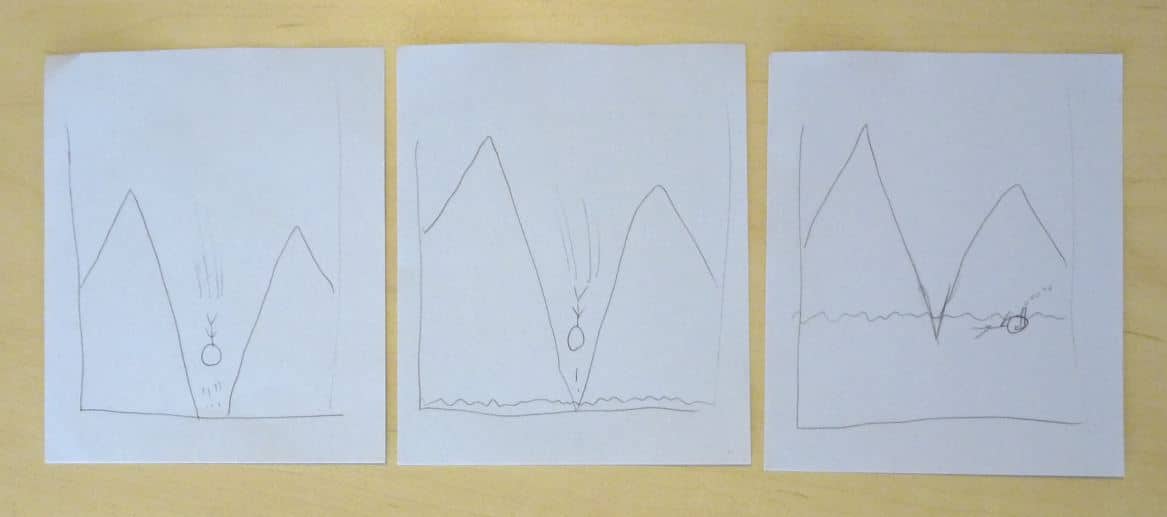
- When there’s not enough float, you’ll hit your head
- When there’s just as much float, you’ll have to be really really careful right around that low point.
- When you have plenty of float, you’ll be okay, you can even move around some of your bills as you please and spend more at certain points of the month, because it doesn’t matter. You’ll never hit your head.
Which one are you more comfortable with? Exactly. That’s why you need to have enough float.
So when completing your money graph, add your float value and draw a water line across. And, because you have a money sign-out sheet, you will want to make sure that the right side of money graph is at the same float line as the left side. Otherwise, that’s not float (your pool is leaking).
If you do this exercise and internalize it, you’ll have a much better sense of what your money does in a given month, better than any table or spreadsheet could ever do. Happy graphing!
But enough about me. It’s time for you to make your money graph. If you do, please send it to me, as I’d love to see it and hear about what you learned when you made it.