WARNING: This post contains math.
I love math. You know this. I think math is one of our world’s ways of expressing beauty. To me, there are few things more pleasing to the eye than a elegant mathematical statement. (People tend to agree on this.)
And so, if for no other reason than we all need more beauty, I want to show you how our effective tax rates are a practical approximation of a beautiful and fundamental mathematical curve.
No, seriously.
Our tax rates in graph form
Recall last time how we talked about how tax brackets work, and how there are those who don’t realize it. This leads some to think that there is some kind of cataclysmic tax event when you go one dollar over the next tax bracket.
That’s not how it works. We have a progressive tax system, not a cataclysmic one. Only the amount over that income threshold will be taxed at that higher rate.
Here is the graph that shows effective tax rate as a function of income.
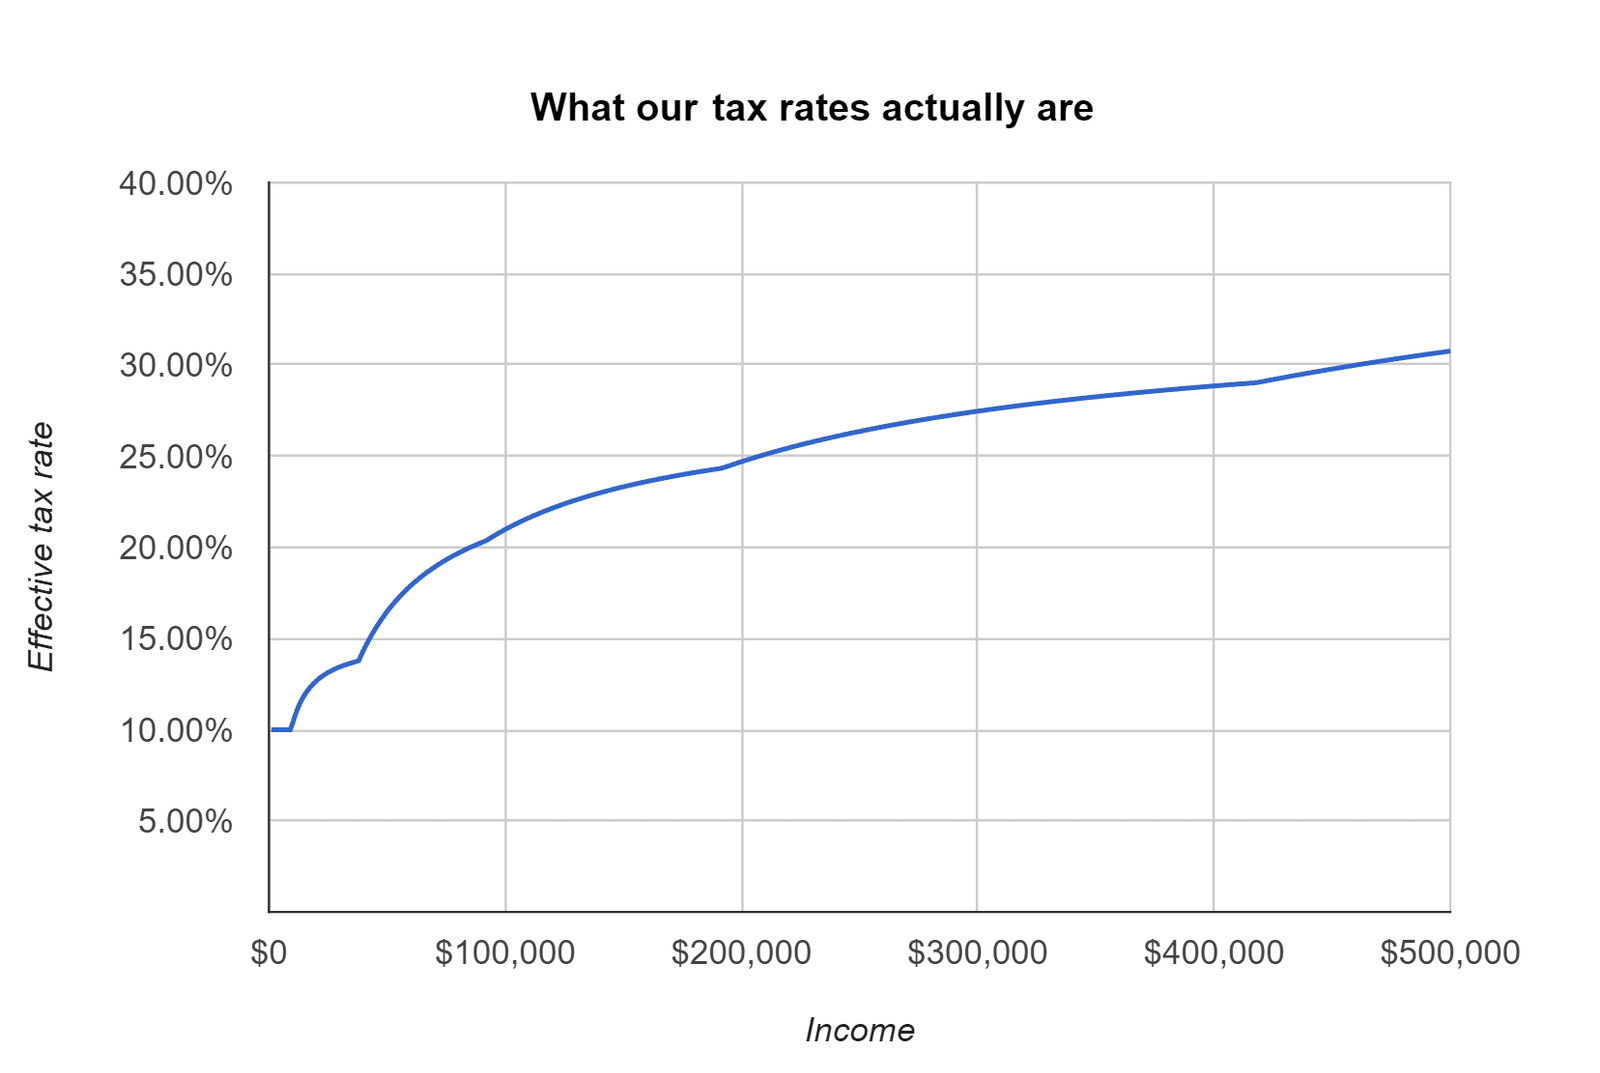
When I created that graph, I paused, seeing a familiarity somewhere. What was I looking at?
Math and nature
You see math a lot in nature. Most people know that pi is the ratio of the circumference of a circle to its diameter. But there are more interesting numbers that show up.
For example, did you know that sunflowers and other plants grow in terms of the Golden Ratio (1.61803)?
And if you know the Fibonacci Sequence (you know, the code that got Tom Hanks into the vault in The DaVinci Code), did you know that the ratios of successive numbers in the Fibonacci sequence approximate the Golden Ratio?
Oh yeah, I just connected Tom Hanks to sunflowers. Go me.

But anyway, you find math in nature all over the place. Curves and spirals always have an elegant mathematical underpinning to them.
And so, it appears, does our tax bracket system.
Taxes and logarithms
When I looked at the curve, I thought about it, and realized that it looked like a logarithmic function.
Remember algebra? A logarithm is the exponent to which another fixed number must be raised to produce that number. A logarithmic function satisfies the equation:
![]()
Which can also be written as:
![]()
And the curve looks like this:
I wanted to find out: could I fit a logarithmic curve to our tax brackets?
Where I (logarithmically) regress
Because the Internet is awesome, I found an Online Logarithmic Regression website. Using the tool, I crunched the numbers, and this is what I found:
![]()
Putting this in graph form, yielded something pretty darn beautiful.
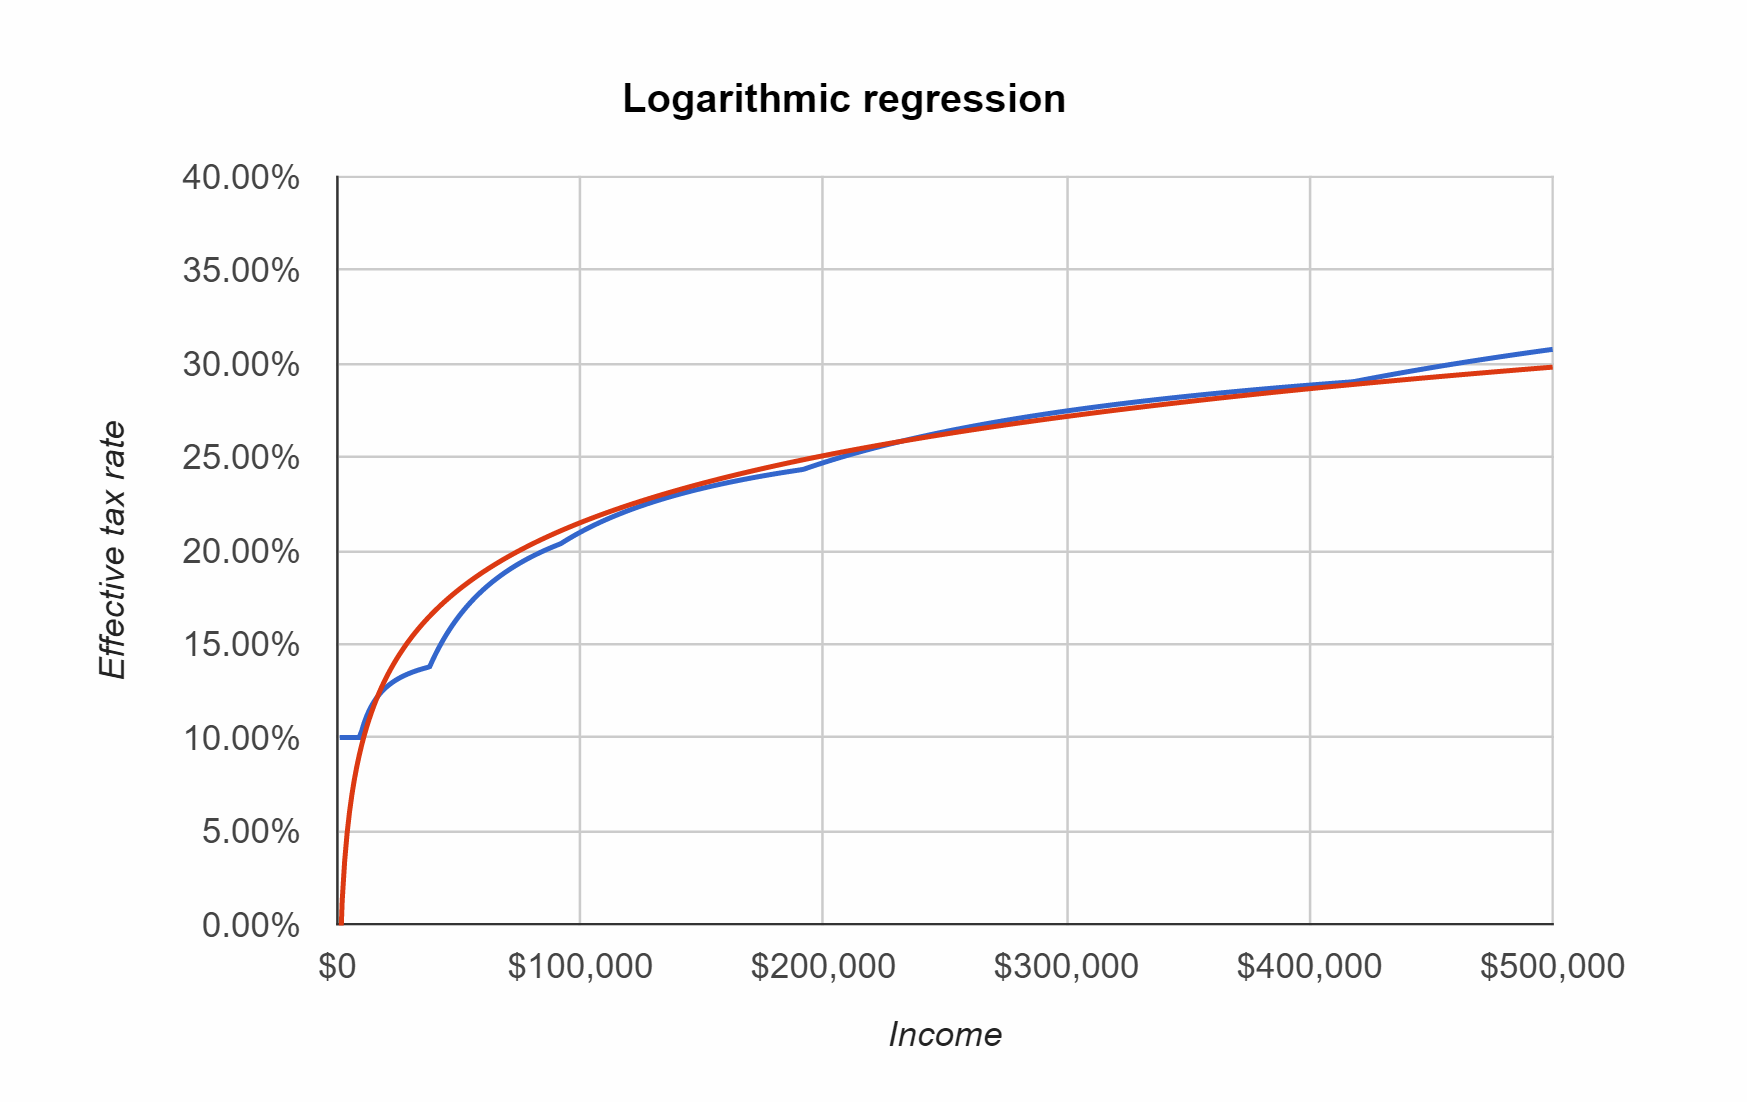
Wow. Aside from lowest incomes, where the slope of the curve is high, and the highest tax bracket, it’s almost a perfect fit. (And if I had excluded those sections, I believe that the fit would have been better still.)
Beauty in taxes
This can’t be an accident. And I’m led to wonder if someone who works in tax policy believed that the most optimal progressive tax is one that follows a logarithmic curve.
Obviously, tax forms are complicated enough, and so whoever was involved surely realized that the most anyone was going to be able to do on a tax form is addition and multiplication.
Though how amazing would it be to see a tax form that looks like this?
…
Line 31: Enter your Adjusted Gross Income.
Line 32: Take the natural logarithm of Line 31.
Line 33: Multiply Line 32 by 5.170136836.
Line 34: Subtract Line 33 by 38.03227732. This is your tax owed.
…
(Arguably, this is not far off from how some people see tax forms as it is.)
So what?
If there are any takeaways from this frivolous adventure, it’s this:
- There is beauty everywhere. You just have to look for it.
- There are patterns everywhere. Localized randomness may be part of a larger plan that we cannot see.
- If you have to deal with them, you might as well find a way to make taxes pleasing to the eye.
- It is possible to make a graphic that includes both Tom Hanks and sunflowers in a post on taxes.
You’re welcome.